|
1 2 3 |
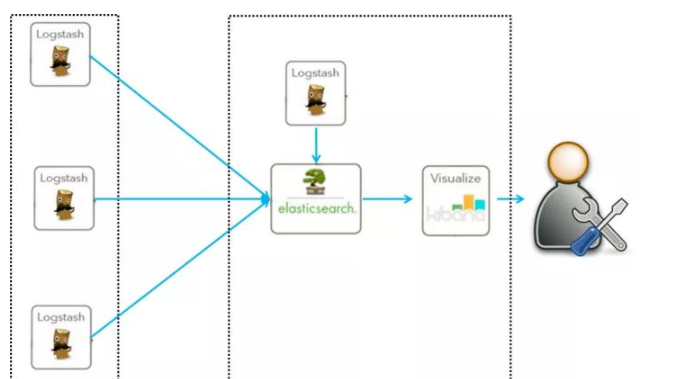
Elasticsearch是实时全文搜索和分析引擎,提供搜集、分析、存储数据三大功能;是一套开放REST和JAVA API等结构提供高效搜索功能,可扩展的分布式系统。它构建于Apache Lucene搜索引擎库之上。 Logstash是一个用来搜集、分析、过滤日志的工具。它支持几乎任何类型的日志,包括系统日志、错误日志和自定义应用程序日志。它可以从许多来源接收日志,这些来源包括 syslog、消息传递(例如 RabbitMQ)和JMX,它能够以多种方式输出数据,包括电子邮件、websockets和Elasticsearch。 Kibana是一个基于Web的图形界面,用于搜索、分析和可视化存储在 Elasticsearch指标中的日志数据。它利用Elasticsearch的REST接口来检索数据,不仅允许用户创建他们自己的数据的定制仪表板视图,还允许他们以特殊的方式查询和过滤数据。 |
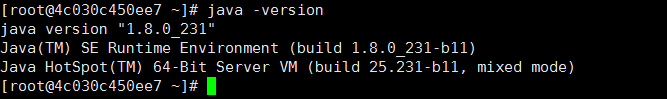
1.环境 java1.8
|
1 2 3 4 5 6 7 8 9 10 11 12 13 |
1.下载jdk1.8(根据你的系统版本来选对应的jdk) 下载地址:http://www.oracle.com/technetwork/java/javase/downloads/jdk8-downloads-2133151.html 2.查看系统位数 getconf LONG_BIT 3.下载解压 tar -zxvf jdk-8u231-linux-x64.tar.gz 4.解压后放到opt目录下 5.配置环境变量(vim /etc/profile) export JAVA_HOME=/opt/jdk1.8.0 export PATH=$JAVA_HOME/bin:$PATH export CLASSPATH=.:$JAVA_HOME/lib/dt.jar:$JAVA_HOME/lib 6.刷新环境变量 . /etc/profile |
测试jdk是否安装成功
|
1 2 3 4 5 6 7 8 |
1.下载Elasticsearch 5.6.4 wget https://artifacts.elastic.co/downloads/elasticsearch/elasticsearch-5.6.4.tar.gz 2.新建一个普通用户(Elasticsearch 只能运行在普通用户下) useradd shooter passwd shooter 3.解压到/opt目录下,并修改权限(先不忙启动) chown -R shooter:shooter /opt/elasticsearch-5.6.4 4.修改配置文件:vim config/elasticsearch.yml |
vim config/elasticsearch.yml 配置参考如下
|
1 2 3 4 5 6 7 8 9 10 11 12 13 14 15 16 17 18 19 20 21 22 23 24 25 26 27 28 29 30 31 32 33 34 |
cluster.name: shooter_els node.master: true node.data: true node.name: node-01 #下面这2行必须在Memory下 bootstrap.memory_lock: false bootstrap.system_call_filter: false network.host: 172.17.0.2 http.port: 9200 transport.tcp.port: 9300 discovery.zen.ping.unicast.hosts: ["172.17.0.2", "172.17.0.4","172.17.0.3"] discovery.zen.minimum_master_nodes: 2 http.cors.enabled: true http.cors.allow-origin: "*" #各行解释如下 bootstrap.memory_lock: false bootstrap.system_call_filter: false 访问方面的配置 cluster.name 集群名字,同一个集群中使用相同名字,单机就随意 node.name: node-01 节点名字 node.master: 是否为集群的master机器(尽量将所有机器设置为允许成为主节点和数据节点,除非机器负载很高) node.data: true 是否作为数据节点 network.host: 192.168.0.1 这个不用自然是配置ip地址的, #集群中对外开放的IP地址 http.port : 9200 #restful 接口调用端口 transport.tcp.port: 9300 #集群内部传输端口 discovery.zen.ping.unicast.hosts: [“192.168.0.1”,”192.168.0.2”,”192.168.0.3”] 这个就是配置集群的时候要用的到了,[]中填上集群中其他集群的ip的地址和端口ip:9300,如果是master的话请把所有salve的机器地址填上 discovery.zen.minimum_master_nodes: 2 #让候选主节点知道为了形成集群而必须可见的最少数量的候选主节点(避免脑裂,候选主节点的数量应该设置为:((master_eligible_nodes/2)+1,即若有三个节点,最小候选主节点数应该是(3/2)+1 =2) http.cors.enabled: true 这个参数的设置和下面一个配置就关于ip的访问策略了,如果你发现其他ip地址访问不了就有可以这参数没有配置 http.cors.allow-origin: "*" xpack.security.enabled: true #如果你安装了xpack,这个要配置上,否则集群节点之间无法通信,因为需要登陆密码 |
配置完 config/elasticsearch.yml 启动 Elasticsearch
|
1 2 3 4 5 6 7 8 9 10 11 12 13 14 15 16 17 18 19 20 21 22 23 24 25 26 27 28 29 30 |
./bin/elasticsearch [启动命令,注意不能以root方式启动,必须是普通用户] [终端命令] [shooter@4c030c450ee7 elasticsearch-5.6.4]$ ./bin/elasticsearch [2019-11-28T00:38:23,240][INFO ][o.e.n.Node ] [node-01] initializing ... [2019-11-28T00:38:23,412][INFO ][o.e.e.NodeEnvironment ] [node-01] using [1] data paths, mounts [[/ (rootfs)]], net usable_space [27.4gb], net total_space [39.2gb], spins? [unknown], types [rootfs] [2019-11-28T00:38:23,413][INFO ][o.e.e.NodeEnvironment ] [node-01] heap size [1.9gb], compressed ordinary object pointers [true] [2019-11-28T00:38:23,416][INFO ][o.e.n.Node ] [node-01] node name [node-01], node ID [wOIbFASCTKOXNJEAXAzTIw] [2019-11-28T00:38:23,417][INFO ][o.e.n.Node ] [node-01] version[5.6.4], pid[19079], build[8bbedf5/2017-10-31T18:55:38.105Z], OS[Linux/3.10.0-1062.4.3.el7.x86_64/amd64], JVM[Oracle Corporation/Java HotSpot(TM) 64-Bit Server VM/1.8.0_231/25.231-b11] [2019-11-28T00:38:23,418][INFO ][o.e.n.Node ] [node-01] JVM arguments [-Xms2g, -Xmx2g, -XX:+UseConcMarkSweepGC, -XX:CMSInitiatingOccupancyFraction=75, -XX:+UseCMSInitiatingOccupancyOnly, -XX:+AlwaysPreTouch, -Xss1m, -Djava.awt.headless=true, -Dfile.encoding=UTF-8, -Djna.nosys=true, -Djdk.io.permissionsUseCanonicalPath=true, -Dio.netty.noUnsafe=true, -Dio.netty.noKeySetOptimization=true, -Dio.netty.recycler.maxCapacityPerThread=0, -Dlog4j.shutdownHookEnabled=false, -Dlog4j2.disable.jmx=true, -Dlog4j.skipJansi=true, -XX:+HeapDumpOnOutOfMemoryError, -Des.path.home=/opt/elasticsearch-5.6.4] [2019-11-28T00:38:25,032][INFO ][o.e.p.PluginsService ] [node-01] loaded module [aggs-matrix-stats] [2019-11-28T00:38:25,032][INFO ][o.e.p.PluginsService ] [node-01] loaded module [ingest-common] [2019-11-28T00:38:25,032][INFO ][o.e.p.PluginsService ] [node-01] loaded module [lang-expression] [2019-11-28T00:38:25,032][INFO ][o.e.p.PluginsService ] [node-01] loaded module [lang-groovy] [2019-11-28T00:38:25,033][INFO ][o.e.p.PluginsService ] [node-01] loaded module [lang-mustache] [2019-11-28T00:38:25,033][INFO ][o.e.p.PluginsService ] [node-01] loaded module [lang-painless] [2019-11-28T00:38:25,033][INFO ][o.e.p.PluginsService ] [node-01] loaded module [parent-join] [2019-11-28T00:38:25,033][INFO ][o.e.p.PluginsService ] [node-01] loaded module [percolator] [2019-11-28T00:38:25,033][INFO ][o.e.p.PluginsService ] [node-01] loaded module [reindex] [2019-11-28T00:38:25,033][INFO ][o.e.p.PluginsService ] [node-01] loaded module [transport-netty3] [2019-11-28T00:38:25,033][INFO ][o.e.p.PluginsService ] [node-01] loaded module [transport-netty4] [2019-11-28T00:38:25,034][INFO ][o.e.p.PluginsService ] [node-01] no plugins loaded [2019-11-28T00:38:28,303][INFO ][o.e.d.DiscoveryModule ] [node-01] using discovery type [zen] [2019-11-28T00:38:29,369][INFO ][o.e.n.Node ] [node-01] initialized [2019-11-28T00:38:29,369][INFO ][o.e.n.Node ] [node-01] starting ... [2019-11-28T00:38:29,635][INFO ][o.e.t.TransportService ] [node-01] publish_address {172.17.0.2:9300}, bound_addresses {172.17.0.2:9300} [2019-11-28T00:38:29,676][INFO ][o.e.b.BootstrapChecks ] [node-01] bound or publishing to a non-loopback or non-link-local address, enforcing bootstrap checks [2019-11-28T00:38:32,795][WARN ][o.e.d.z.ZenDiscovery ] [node-01] not enough master nodes discovered during pinging (found [[Candidate{node={node-01}{wOIbFASCTKOXNJEAXAzTIw}{28Nbf4s8SmOQVCG3D5guZg}{172.17.0.2}{172.17.0.2:9300}, clusterStateVersion=-1}]], but needed [2]), pinging again [2019-11-28T00:38:35,802][WARN ][o.e.d.z.ZenDiscovery ] [node-01] not enough master nodes discovered during pinging (found [[Candidate{node={node-01}{wOIbFASCTKOXNJEAXAzTIw}{28Nbf4s8SmOQVCG3D5guZg}{172.17.0.2}{172.17.0.2:9300}, clusterStateVersion=-1}]], but needed [2]), pinging again [2019-11-28T00:38:38,808][WARN ][o.e.d.z.ZenDiscovery ] [node-01] not enough master nodes discovered during pinging (found [[Candidate{node={node-01}{wOIbFASCTKOXNJEAXAzTIw}{28Nbf4s8SmOQVCG3D5guZg}{172.17.0.2}{172.17.0.2:9300}, clusterStateVersion=-1}]], but needed [2]), pinging again |
后台模式启动 ./bin/elasticsearch -d
停止elasticsearch : ps -ef | grep elastic , kill -9 2382(进程号)
常见错误
|
1 2 3 4 5 6 7 8 9 10 11 12 13 14 15 16 17 18 19 20 21 22 23 24 25 26 27 28 29 30 31 32 33 34 35 |
如果你碰到以下错误不要慌,下面有解决方法: <1>. max file descriptor 或者 bootstrap checks failed max file descriptors [4096] for elasticsearch process is too low, increase to at least [65536] 解决方法,请用root权限修改,修改完记得重启elasticsearch和使用配置参数在环境里面生效(重新登录用户):(如果还有错误请把数字再设置大一点) vi /etc/security/limits.conf * soft nofile 65536 * hard nofile 131072 * soft nproc 2048 * hard nproc 4096 <2>.max virtual memory areas vm.max_map_count [65530] is too low, increase to at least [262144] 临时设置办法:sudo sysctl -w vm.max_map_count=262144 永久修改: (新建/修改)/etc/sysctl.conf 文件,添加 vm.max_map_count=262144 并执行:sysctl -p 修改完记得重启elasticsearch和使用配置参数在环境里面生效(重新登录用户):(如果还有错误请把数字再设置大一点) <3>max number of threads max number of threads [1024] for user [user] is too low, increase to at least [2048] 解决方法: (* 表示对所有用户有效) vim /etc/security/limits.d/90-nproc.conf #修改内容如下 * soft nproc 1024 <4>在elasticsearch.yml中配置bootstrap.system_call_filter为false,注意要在Memory下面: bootstrap.memory_lock: false bootstrap.system_call_filter: false <5>max number of threads [1024] for user [work] likely too low, increase to at least [2048] vim /etc/security/limits.d/20-nproc.conf * soft nproc 4096 修改为: * soft nproc 8192 |

3.安装x-pack插件
|
1 2 3 4 5 6 7 8 |
1.自动安装 cd /opt/elasticsearch-5.6.4 执行: bin/elasticsearch-plugin install x-pack 2.手动安装(自动安装太慢,于是手动安装) 手动下载X-Pack zip文件:https://artifacts.elastic.co/downloads/packs/x-pack/x-pack-5.6.4.zip 3.将插件包不要放到elasticsearch 外的任何目录,然后执行如下命令 bin/elasticsearch-plugin install file:///home/shooter/ruanjian/x-pack-6.2.4.zip(自己路径自己替换) |
4.配置开机启动
vim /etc/init.d/elasticsearch
|
1 2 3 4 5 6 7 8 9 10 11 12 13 14 15 16 17 18 19 20 21 22 23 24 25 26 27 28 29 30 31 32 |
#!/bin/sh #chkconfig: 2 3 4 5 80 05 #description: Elasticsearch source /etc/profile case "$1" in start) su shooter<<! cd /opt/elasticsearch-5.6.4 ./bin/elasticsearch -d ! echo "Elasticsearch startup ..." ;; stop) es_pid=`ps aux|grep elasticsearch | grep -v 'grep elasticsearch' | awk '{print $2}'` kill -9 $es_pid echo "Elasticsearch stopped ..." ;; restart) es_pid=`ps aux|grep elasticsearch | grep -v 'grep elasticsearch' | awk '{print $2}'` kill -9 $es_pid echo "Elasticsearch stopped ..." su es<<! cd /opt/elasticsearch-5.6.4 ./bin/elasticsearch -d ! echo "Elasticsearch startup ..." ;; *) echo "start|stop|restart" ;; esac exit $? |
|
1 2 3 4 5 6 |
#设置开机启动 chmod +x /etc/init.d/elasticsearch chkconfig --add elasticsearch chkconfig elasticsearch on service elasticsearch start 注意这个脚本最好以root 执行 以为他脚本里执行start命令 需要切换到普通用户,如果是普通用户执行这个脚本 提示要输入密码 |
5.创建索引(这个索引是一定要创建的,否则集群里其他机器的日志通过什么来连接检索呢)
|
1 2 3 4 5 6 7 8 9 10 11 12 13 14 |
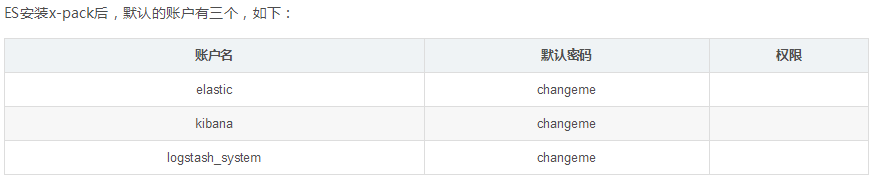
#注意下这里要输入密码,密码参考上图 #注意这里的索引文件log_to_es_test是和logstash配置文件simple.conf 里的名称对应的,后面安装logstash你就知道 1.创建索引 curl -u elastic:changeme -XPUT '172.17.0.2:9200/log_to_es_test' 2.查看索引 curl -u elastic:changeme '172.17.0.2:9200/_cat/indices?v' 3.删除索引 curl -u elastic:changeme -XDELETE '172.17.0.2:9200/log_to_es_log' ############ 删一个索引: XDELETE /nginx-%{day} 删多个索引: XDELETE /index_one,index_two 通配符删索引: XDELETE /index_* 删除所有索引: XDELETE /_all ############ |
创建索引报错
|
1 2 3 4 5 6 7 |
{"error":{"root_cause":[{"type":"master_not_discovered_exception","reason":null}],"type":"master_not_discovered_exception","reason":null},"status":503} 解决办法 将 #discovery.zen.minimum_master_nodes: 3 注释打开,修改为discovery.zen.minimum_master_nodes: 1 重启ec服务 看看如何 可能是因为当前我只有一台机器在连接运行,其他2台未运行,具体原因目前还不得知,有知道的欢迎留言探讨。 |
6.查看节点状态
|
1 2 3 4 |
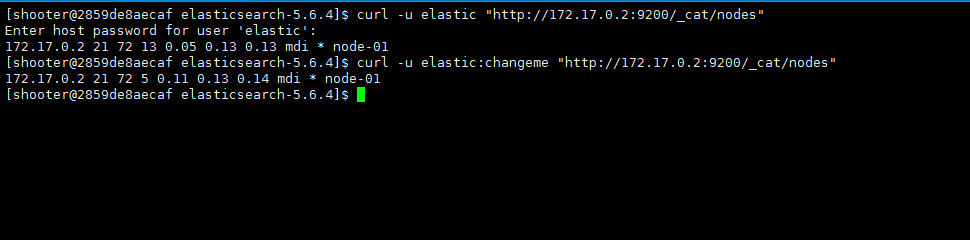
curl -u elastic "http://172.17.0.2:9200/_cat/nodes" #需要输入密码 curl -u elastic:changeme "http://172.17.0.2:9200/_cat/nodes" #也可以直接带上密码 因为我目前只配了一台机器所以我只看到一台 |
7. 查看elasticsearch是否启动
|
1 2 3 4 5 6 |
[命令] jps [root@4c030c450ee7 init.d]# jps 24864 Jps 19474 Elasticsearch 22663 PluginCli |
#head插件可装可不装,如果你想做Elasticsearch集群就装完这个就ok了,如果你做的是ELK,可以跳过这个直接去第二步装kibana,当然你装上也无妨,看个人
8.安装head插件( head插件是一个ES集群的web前端工具,它提供可视化的页面方便用户查看节点信息,对ES进行各种操作,如查询、删除、浏览索引等)
<1.> 安装node
head插件本质上还是一个nodejs的工程,因此需要安装node,使用npm来安装依赖的包
|
1 2 |
#我图简单是直接用yum命令安装 yum install -y nodejs |
源码安装
|
1 2 3 4 5 6 7 8 9 |
yum -y install gcc make gcc-c++ openssl-devel wget 下载源码及解压: wget http://nodejs.org/dist/v0.10.26/node-v0.10.26.tar.gz tar -zvxf node-v0.10.26.tar.gz 编译及安装: cd node-v0.10.26 make && make install 验证是否安装配置成功: node -v |

<2.> 安装elasticsearch-head
|
1 2 3 4 5 6 7 |
#另外:5.0以前的版本可以通过elasticseach自带的plugin命令 安装elasticsearch-head,5.0以后不支持了。只可以去下载elasticsearch-head对应的源码包去安装。 cd /opt/ git clone git://github.com/mobz/elasticsearch-head.git cd elasticsearch-head #安装 npm install |
配置
|
1 2 3 4 5 6 |
vim _site/app.js # 修改 this.base_uri = this.config.base_uri || this.prefs.get("app-base_uri") || "http://localhost:9200"; # 在文件的4374行附近 # 这里的 localhost 是指进入elasticsearch-head页面时默认访问的ES集群地址,把她修改为其中一台ES节点的地址即可(注意9200端口不要改) this.base_uri = this.config.base_uri || this.prefs.get("app-base_uri") || "http://你的ESIP:9200"; |
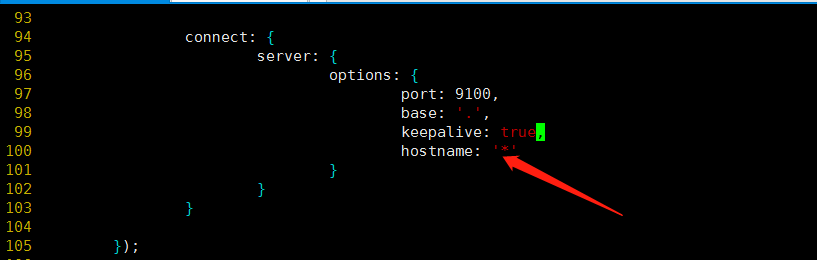
还要修改Head主目录下的Gruntfile.js,由于默认文件中是没有hostname属性的,我们需要手动添加:
|
1 2 3 4 5 6 7 8 9 |
#为什么需要修改配置文件: head插件连接elasticsearch需要注意的点: 因为head插件是一个独立进程,启动后是一个独立的服务器外加端口,比如我的虚拟机ip地址:http://172.10.0.2:9100/ 而elasticsearch启动后也是一个独立的进程,ip地址:http://172.10.0.2:9200/ 这样两个独立进程,虽然服务器ip地址相同,但是端口不同,此时会发生跨域的情况。。 于是官方给出这样一段话,我们在对elasticsearch启动的时候追加两个配置文件属性即可防止跨域。(如下配置) |
即:在elasticsearch.yml文件的最后,添加如下内容:
|
1 2 |
http.cors.enabled: true http.cors.allow-origin: "*" |
<3.> 安装grunt ( 5.6里的head插件就是通过grunt启动的。因此需要安装一下 。grunt是一个很方便的构建工具,可以进行打包压缩、测试、执行等等的工作)
|
1 2 |
cd /opt/elasticsearch-head npm install -g grunt-cli #执行后会生成node_modules文件夹 |
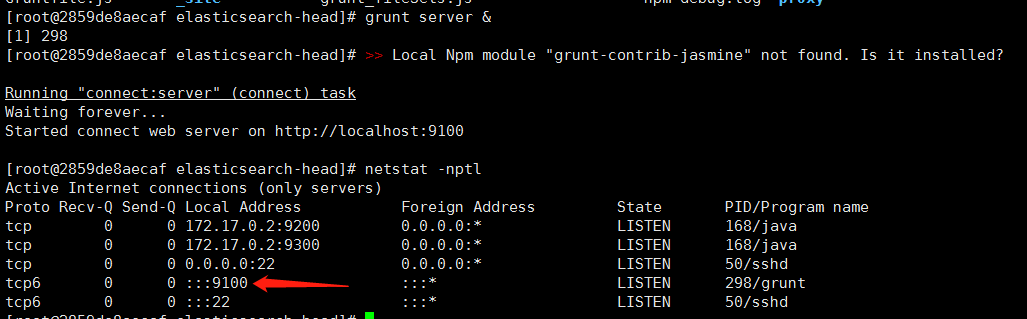
<4.>启动elasticsearch-head
|
1 2 |
cd /opt/elasticsearch-head grunt server & #后台启动 |
访问前端页面
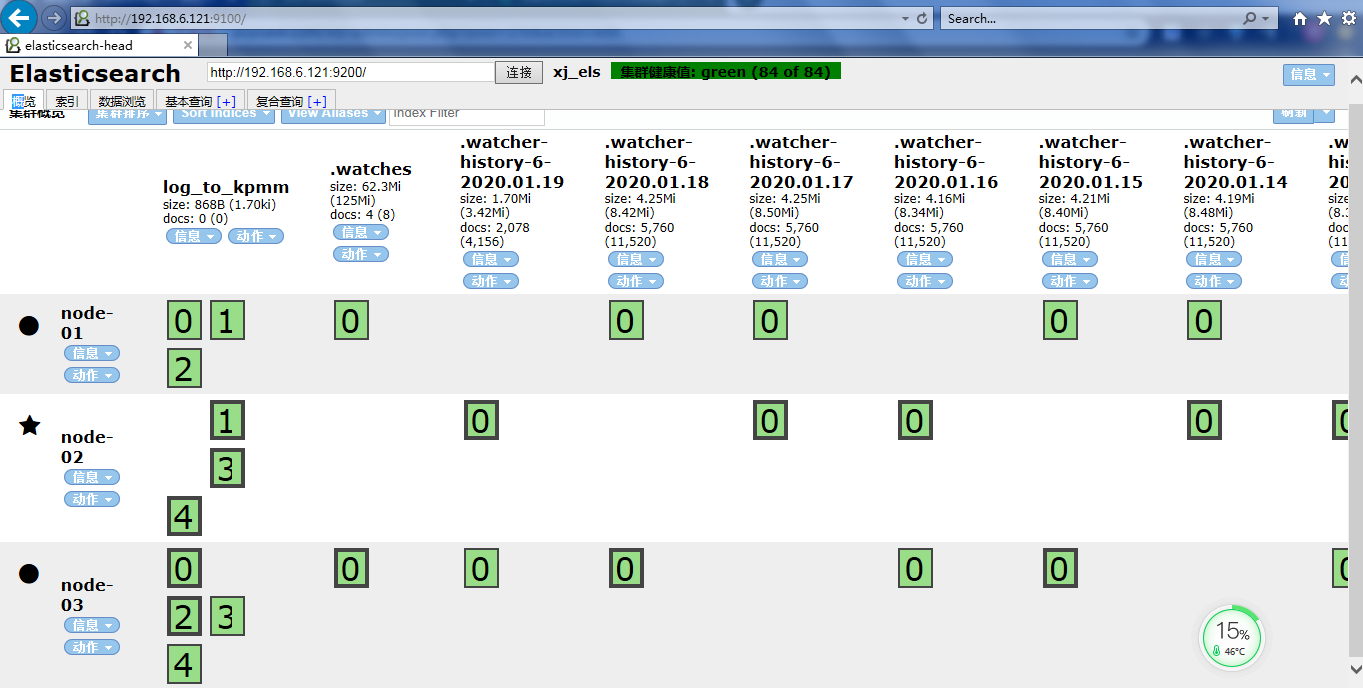
#关于集群健康值未连接的这个错误是因为他必须要用ip加端口访问,不支持localhost或者127.0.0.1这种,必须是真实的ip 详情请看这里 传送 门
|
1 2 3 4 5 6 7 8 |
#head页面状态解析: 绿色,最健康的状态,代表所有的分片包括备份都可用 黄色,基本的分片可用,但是备份不可用(也可能是没有备份) 红色,部分的分片可用,表明分片有一部分损坏。此时执行查询部分数据仍然可以查到,遇到这种情况,还是赶快解决比较好 灰色,未连接到elasticsearch服务 |
注意:这个head太垃圾了,可能google 和其他浏览器都不兼容,ie看起来勉勉强强
—————————————————–此处head安装已完结,做Elasticsearch集群的小伙伴到这里就结束了————————————-
二 . 安装kibana
1.下载kibana
|
1 2 3 |
#可能下载时间较长 wget https://artifacts.elastic.co/downloads/kibana/kibana-5.6.4-linux-x86_64.tar.gz tar -zxvf kibana-5.6.4-linux-x86_64.tar.gz |
2 .修改配置文件
|
1 2 3 4 5 6 7 |
#vi /opt/kibana-5.6.4/config/kibana.yml 修改如下配置: server.port: 5601 #默认web端口 server.host: 172.17.0.2 #kibana服务器地址也即web地址IP,写本机ip即可 elasticsearch.url : "http://172.17.0.2:9200" #从elasticsearch 中获取数据的地址,写本机ip即可 #启动时索引。您的Kibana用户需要通过Elasticsearch进行身份验证(如果你es也装了x-pack那么就需要身份验证) elasticsearch.username: "elastic" elasticsearch.password: "changeme" |
3. 安装x-pack 5.6.4
|
1 2 3 4 5 6 7 8 |
1.自动安装 #安装过程可能会有点长,视网络情况而定 (另外希望你留有足够大的内存,最好3G以上否则安装到最后会 killd 自己杀死自己,因为内存不足cpu过高自行了断安装失败了) bin/kibana-plugin install x-pack 2.手动安装 自行下载:https://artifacts.elastic.co/downloads/kibana-plugins/x-pack/x-pack-5.6.4.zip #下载完成后放到kibana的kibana-plugin目录下,然后在kibana目录执行 bin/kibana-plugin install file:///opt/kibanna-5.6.4/plugins/x-pack-5.6.4.zip |

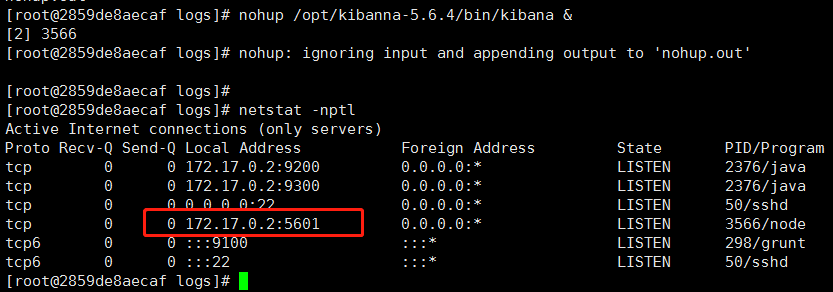
4. 启动kibana
|
1 2 3 4 5 |
mkdir -p /opt/kibana-5.6.4/logs cd /opt/kibana-5.6.4/logs nohup ../bin/kibana & |
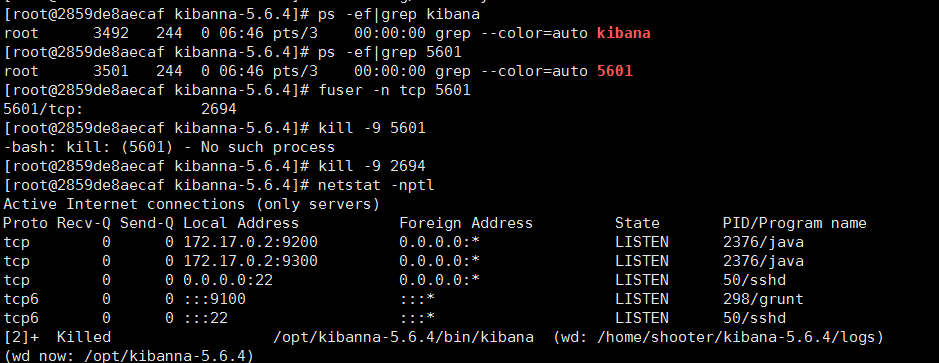
5.停止kibana
|
1 2 3 4 5 6 7 8 9 10 |
ps -ef|grep kibana ps -ef|grep 5601 都找不到 尝试 使用 fuser -n tcp 5601 kill -9 端口 ps -ef|grep node 或 netstat -anltp|grep 5601 启动即可 ./kibana 后台启动: nohup ../bin/kibana & |
三.安装logstash
|
1 2 |
wget https://artifacts.elastic.co/downloads/logstash/logstash-5.6.4.tar.gz tar -zxvf logstash-5.6.4.tar.gz |
2.新建/修改配置文件
|
1 2 3 4 5 6 7 8 9 10 11 12 13 14 15 16 17 18 19 20 21 22 23 24 25 26 27 28 29 30 31 32 |
#vim logstash-5.6.4/config/simple.conf input { file { path =>["/home/shooter/projectLog/processorhbase/142_1/processorhbase_*","/home/shooter/projectLog/processorhbase/142_2/processorhbase_*", "/home/shooter/projectLog/processorhbase/169_1/processorhbase_*","/home/shooter/projectLog/processorhbase/169_2/processorhbase_*"] start_position => "beginning" sincedb_path => "/dev/null" codec => multiline { pattern => "^\d" negate => true what => "previous" } } } output { # stdout { # codec => rubydebug # } elasticsearch { hosts => ["172.17.0.2:9200"] index => "log_to_es_test" user => elastic password => changeme } } #注 logstash主要用来收集日志,功能很强大,里面有很多plugin(插件),主要分为三部分(当然还有codec), input(接收,导入日志源,主要用来做日志输入,path可以支持多个路径) filter(过滤,日志中不需要的信息)#上图基础配置中没有filter,只做基本输入输出测试 output(输出日志到某个地方,例如:es,redis,等等) hosts => ["172.17.0.2:9200"] 这个各自机器写各自ip,发送到各自esearch即可 |
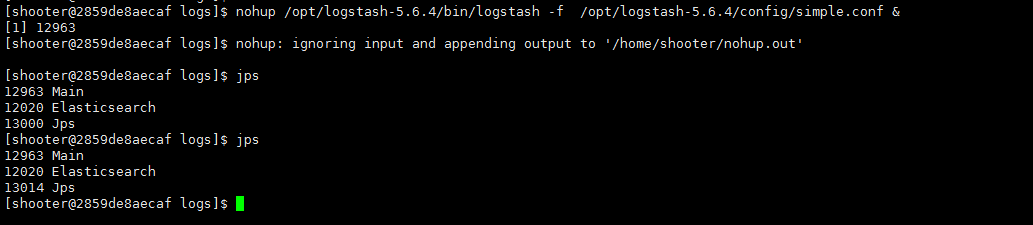
3.启动logstash
|
1 2 3 4 5 6 7 |
mkdir -p /opt/logstash-5.6.4/logs cd /opt/logstash-5.6.4/logs nohup ../bin/logstash -f ../config/simple.conf 后台启动 nohup(不挂断运行) nohup ../bin/logstash -f ../config/simple.conf & tail -f nohup.out #查看启动日志 |
4.查看是否启动
5.如何正确的关闭logstash?
在生产环境下,无法平滑的关闭(kill 进程号)logstash
|
1 2 3 4 5 |
解决方案: <1>ps -ef | grep logstash 通过kill -9或者设置--allow-unsafe-shutdown参数为true的方式可以关闭 缺点:会丢失数据 <2>通过设置config/logstash.yml中进行配置以下内容进行持久化再通过第一种方式进行关闭 |
|
1 2 3 4 5 6 7 8 |
queue.type: persisted path.queue: /usr/share/logstash/data #队列存储路径;如果队列类型为persisted,则生效 queue.page_capacity: 250mb #队列为持久化,单个队列大小 queue.max_events: 0 #当启用持久化队列时,队列中未读事件的最大数量,0为不限制 queue.max_bytes: 1024mb #队列最大容量 queue.checkpoint.acks: 1024 #在启用持久队列时强制执行检查点的最大数量,0为不限制 queue.checkpoint.writes: 1024 #在启用持久队列时强制执行检查点之前的最大数量的写入事件,0为不限制 queue.checkpoint.interval: 1000 #当启用持久队列时,在头页面上强制一个检查点的时间间隔 |
logstash默认占用端口9600
Logstash配置以服务方式运行
|
1 2 3 |
logstash最常见的运行方式即命令行运行: cd /opt/logstash-5.6.4/logs && nohup ../bin/logstash -f ../config/simple.conf & 这种方式的优点在于运行方便,但是缺点也很明显,不便于管理,同时如果遇到服务器重启,则维护成本会更高一些,如果在生产环境运行logstash建议还是使用服务的方式运行。本文介绍如何将logstash加入linux的service中,以服务的方式启动logstash,同时借助service的特性实现开机自启动的能力。 |
1. 在安装目录下修改startip.optins文件
|
1 |
vim /opt/logstash-5.6.4/config/startup.options |
|
1 2 3 4 5 6 7 8 9 10 11 12 13 14 15 16 17 18 19 20 21 22 23 24 25 26 27 28 29 30 31 32 33 34 35 36 37 |
#JAVACMD=/usr/bin/java JAVA_HOME=/opt/jdk1.8.0 # Set a home directory LS_HOME=/opt/logstash-5.6.4 # logstash settings directory, the path which contains logstash.yml LS_SETTINGS_DIR="${LS_HOME}/config" # Arguments to pass to logstash LS_OPTS="--path.settings ${LS_SETTINGS_DIR} -f /opt/logstash-5.6.4/config/simple.conf" # Arguments to pass to java LS_JAVA_OPTS="" # pidfiles aren't used the same way for upstart and systemd; this is for sysv users. LS_PIDFILE=/var/run/logstash.pid # user and group id to be invoked as LS_USER=root LS_GROUP=root # Enable GC logging by uncommenting the appropriate lines in the GC logging # section in jvm.options LS_GC_LOG_FILE=/var/log/logstash/gc.log # Open file limit LS_OPEN_FILES=16384 # Nice level LS_NICE=19 # Change these to have the init script named and described differently # This is useful when running multiple instances of Logstash on the same # physical box or vm SERVICE_NAME="logstash" SERVICE_DESCRIPTION="logstash" |
配置文件解释:
|
1 2 3 4 5 6 7 8 9 10 11 12 |
startup.options参数: JAVACMD=/usr/bin/java 本地jdk LS_HOME=/opt/logstash logstash所在目录 LS_SETTINGS_DIR="${LS_HOME}/config" 默认logstash配置文件目录 LS_OPTS="–path.settings ${LS_SETTINGS_DIR}" logstash启动命令参数 指定配置文件目录 LS_JAVA_OPTS="" 指定jdk目录 LS_PIDFILE=/var/run/logstash.pid logstash.pid所在目录 LS_USER=logstash logstash启动用户 LS_GROUP=logstash logstash启动组 LS_GC_LOG_FILE=/var/log/logstash/gc.log logstash jvm gc日志路径 LS_OPEN_FILES=65534 logstash最多打开监控文件数量 |
创建服务
|
1 2 3 |
/opt/logstash-5.6.4/bin/system-install 完成后在会在这里创建一个配置文件/etc/systemd/system/logstash.service |
启动Logstash服务
- 设置服务自启动:systemctl enable logstash
- 启动服务:systemctl start logstash
- 停止服务:systemctl stop logstash
- 重启服务:systemctl restart logstash
- 查看服务状态:systemctl status logstash
查看日志
|
1 2 3 |
默认情况下日志会保存在以下两个位置 /var/log/messages /opt/logstash-5.6.4/logs |
—————————————————–分割线——————————————————
登录: http://192.168.6.121:5601/
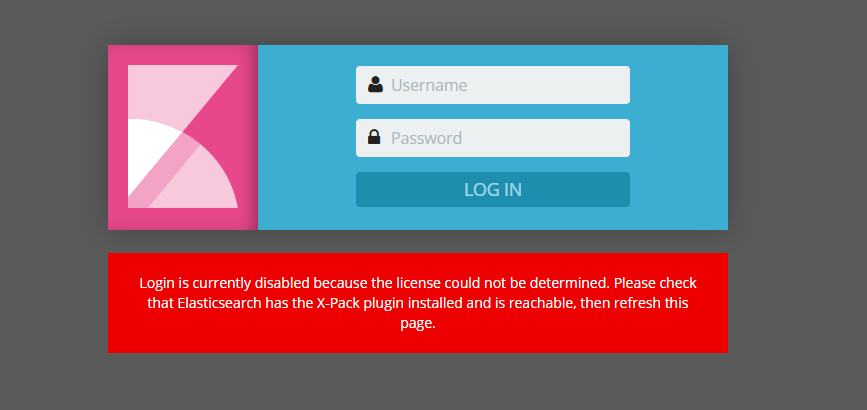
#蛋疼问题1:kibana登陆界面提示需要安装x-pack才可以输账号密码,这里如果你没有安装x-pack就装一下(elast和kibana都要装),如果你都装了,还是提示你安装x-pack 你就把elasticsearch下的data文件夹删掉,然后重启下elasticsearch就可以登录了
#蛋疼问题2:如果你的es更改了密码,kibana的配置文件里没有改,也会报上面那个识别不了插件的错误,解决方法,去kibana的配置文件把es的账号和密码写对
|
1 2 |
elasticsearch.username: "elastic" elasticsearch.password: "123456" |
其他命令
|
1 2 3 4 5 6 7 8 9 10 11 12 13 14 15 16 17 18 19 20 21 22 23 24 25 26 27 28 |
1.修改elasticsearch初始密码 curl -XPUT -u elastic '172.17.0.2:9200/_xpack/security/user/elastic/_password' -H "Content-Type: application/json" -d '{ "password" : "123456" }' 2.修改kibana初始密码 curl -XPUT -u elastic '172.17.0.2:9200/_xpack/security/user/kibana/_password' -H "Content-Type: application/json" -d '{ "password" : "123456" }' 3.新建角色 curl -XPOST -u elastic '172.17.0.2:9200/_xpack/security/role/events_admin' -H "Content-Type: application/json" -d '{ "indices" : [ { "names" : [ "events*" ], "privileges" : [ "all" ] }, { "names" : [ ".kibana*" ], "privileges" : [ "manage", "read", "index" ] } ] }' 4.新创建账户 curl -XPOST -u elastic '172.17.0.2:9200/_xpack/security/user/admin' -H "Content-Type: application/json" -d '{ "password" : "111111", "full_name" : "administrator", "email" : "admin@anony.mous", "roles" : [ "events_admin" ] }' |
如果你更改了 es的默认密码,那么kibana配置文件里需要增加如下配置(因为默认的密码都默认知道,修改后的kibana就不知道es的密码了)
|
1 2 |
elasticsearch.username: "elastic" elasticsearch.password: "123456" |
(完)
补充:关于ecs证书过期错误处理
|
1 2 3 4 |
[root@xjjh-test1 ~]curl -u elastic:changeme '192.168.6.121:9200/_cat/indices?v' {"error":{"root_cause":[{"type":"security_exception","reason":"current license is non-compliant for [security]","license.expired.feature":"security"}],"type":"security_exception","reason":"current license is non-compliant for [security]","license.expired.feature":"security"},"status":403} 翻译: { “错误” :{ “ root_cause” :[ { “ type” :“ security_exception” ,“ reason” :“当前许可证不符合[security]” ,“ license.expired.feature” :“ security” } ] ,“类型” :“ security_exception” ,“原因” :“当前许可证不符合[安全性]” ,“ license.expired.feature” :“安全性” },“状态” :403 } |
查看日志 logs/xj_els.log
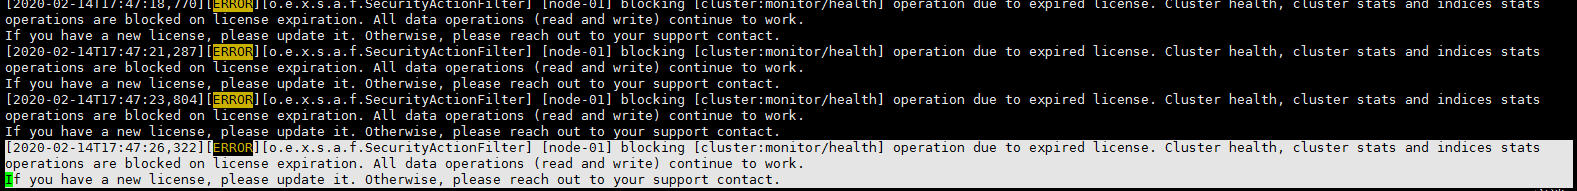
这一段详细说了:经营许可证过期,集群健康状态、集群统计信息和索引统计信息。许可证到期时将阻止操作。所有数据操作(读和写)继续工作。看到这里,应该就明白了,是许可证过期导致的问题。
解决方法 传送门 这位博主写的很好,我就不再造轮子了
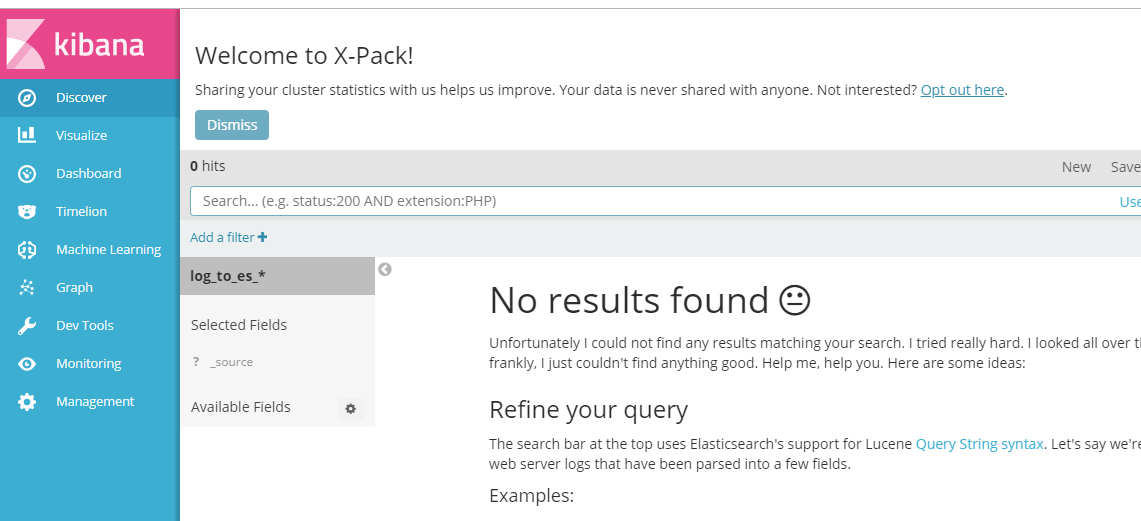
顺便多说一句,免费证书没有安全验证功能,所以安装后不要奇怪为什么不用登录就可以访问kibana后台。
- 本文固定链接: https://www.yoyoask.com/?p=376
- 转载请注明: shooter 于 SHOOTER 发表