接elk配置继续 elk配置前一篇 传送门
1.配置nginx日志和网站配置文件
|
1 2 3 4 |
nginx.conf 日志以json格式输出,方便logstash解析; 因为syslog协议一条消息最大2K,因此有些变了做了阶段(_short后缀的变量); level1domain、level2domain分别指一级域名、二级域名; |
|
1 2 3 |
log_format main_json '{"project":"${level1domain}","domain":"${level1domain}_${level2domain}","real_ip":"$real_ip","http_x_forwarded_for":"$http_x_forwarded_for","time_local":"$time_iso8601"," request":"$request_short","request_body":"$request_body_short","status":$status,"body_bytes_sent":"$body_bytes_sent","http_referer":"$http_referer_short","upstream_response_time":"$upstream_re sponse_time","request_time":"$request_time","http_user_agent":"$http_user_agent"}'; |
域名配置文件中www.test.com.conf
|
1 2 3 4 5 6 7 8 9 10 11 12 13 14 15 16 17 18 19 20 21 22 23 24 25 26 27 28 29 30 31 32 33 34 35 36 37 38 39 40 41 42 43 44 |
server { listen 80; server_name www.test.com; location / { root /www/www.test.com/; index index.html index.htm; } if ( $request ~ "^(.{0,750})" ) { set $request_short $1; } if ( $request_body ~ "^(.{0,750})" ) { set $request_body_short $1; } set $http_referer_short "-"; if ( $http_referer ~ "^(.{1,100})" ) { set $http_referer_short $1; } set $real_ip $remote_addr; if ( $http_x_forwarded_for ~ "^(\d+\.\d+\.\d+\.\d+)" ) { set $real_ip $1; } set $level1domain unparse; set $level2domain unparse; if ( $server_name ~ "^(.+)\.([0-9a-zA-Z]+)\.(com|cn)$" ) { set $level1domain $2; set $level2domain $1; } if ( $server_name ~ "^([0-9a-zA-Z]+)\.(com|cn)$" ) { set $level1domain $1; set $level2domain none; } error_page 500 502 503 504 /50x.html; location = /50x.html { root html; } access_log syslog:server=172.17.0.2:515,facility=local7,tag=nginx_access,severity=info main_json; } |
解析配置文件:
|
1 2 3 4 5 6 7 8 9 10 11 12 13 14 15 16 17 18 19 20 21 22 23 24 25 26 27 28 29 30 31 32 33 34 35 36 37 |
#取前750个字节 if ( $request ~ "^(.{0,750})" ) { set $request_short $1; } #取前750个字节 if ( $request_body ~ "^(.{0,750})" ) { set $request_body_short $1; } #取前100个字节 set $http_referer_short "-"; if ( $http_referer ~ "^(.{1,100})" ) { set $http_referer_short $1; } #从$http_x_forward_for中获取第一个IP,作为客户端实际IP set $real_ip $remote_addr; if ( $http_x_forwarded_for ~ "^(\d+\.\d+\.\d+\.\d+)" ) { set $real_ip $1; } #server_name的格式是:N级域名.……三级域名.二级域名.一级域名.com或cn,或者一级域名.com或cn; #解析一级域名部分为$level1domain #解析一级域名之前的部分为$level2domain set $level1domain unparse; set $level2domain unparse; if ( $server_name ~ "^(.+)\.([0-9a-zA-Z]+)\.(com|cn)$" ) { set $level1domain $2; set $level2domain $1; } if ( $server_name ~ "^([0-9a-zA-Z]+)\.(com|cn)$" ) { set $level1domain $1; set $level2domain none; } #syslog方式输出日志配置 access_log syslog:server=172.17.0.2:515,facility=local7,tag=nginx_access,severity=info main_json; #链接日志 error_log syslog:server=172.17.0.2:515,facility=local7,tag=nginx_access,severity=info main_json; #错误日志 #注:syslog 可能是运维领域最流行的数据传输协议了。当你想从设备上收集系统日志的时候,syslog 应该会是你的第一选择。尤其是网络设备,比如思科 —— syslog 几乎是唯一可行的办法,这里配置的ip是你的本机ip,端口为515(udp协议),然后logstash在配置文件里也要配置和这个515相同的端口(tcp)来接收他发送的日志,大致nginx以syslog方式向logstash发送日志的过程就是如此,此外这个端口你可以自己定义,保持发送端与接收端一致即可。默认如果不设置端口他的端口是514(udp) |
2.配置logstash
logstash配置详解
logstash主要用来收集日志,功能很强大,里面有很多plugin,主要分为三部分(当然还有codec),一部分是input、filter、output,input和output定义输入和输出的位置,基本上可以满足绝大部分需求。filter是logstash强大的主要原因之一,可以进行日志匹配进行过滤,这一步可以看做是数据清洗。分析你想得到的日志,剔除不符合要求的数据,还可以进行日志截取,条件判断等等操作
进入到解压后的logstash的bin目录,运行 ./plugin list 命令可以看到目前能安装的插件,选择你能用到的插件,通过 ./plugin install 插件名 来安装插件即可,配置文件需要手动创建,名字自己定义即可,下面是具体的配置信息,node1的logstash配置文件如图所示:
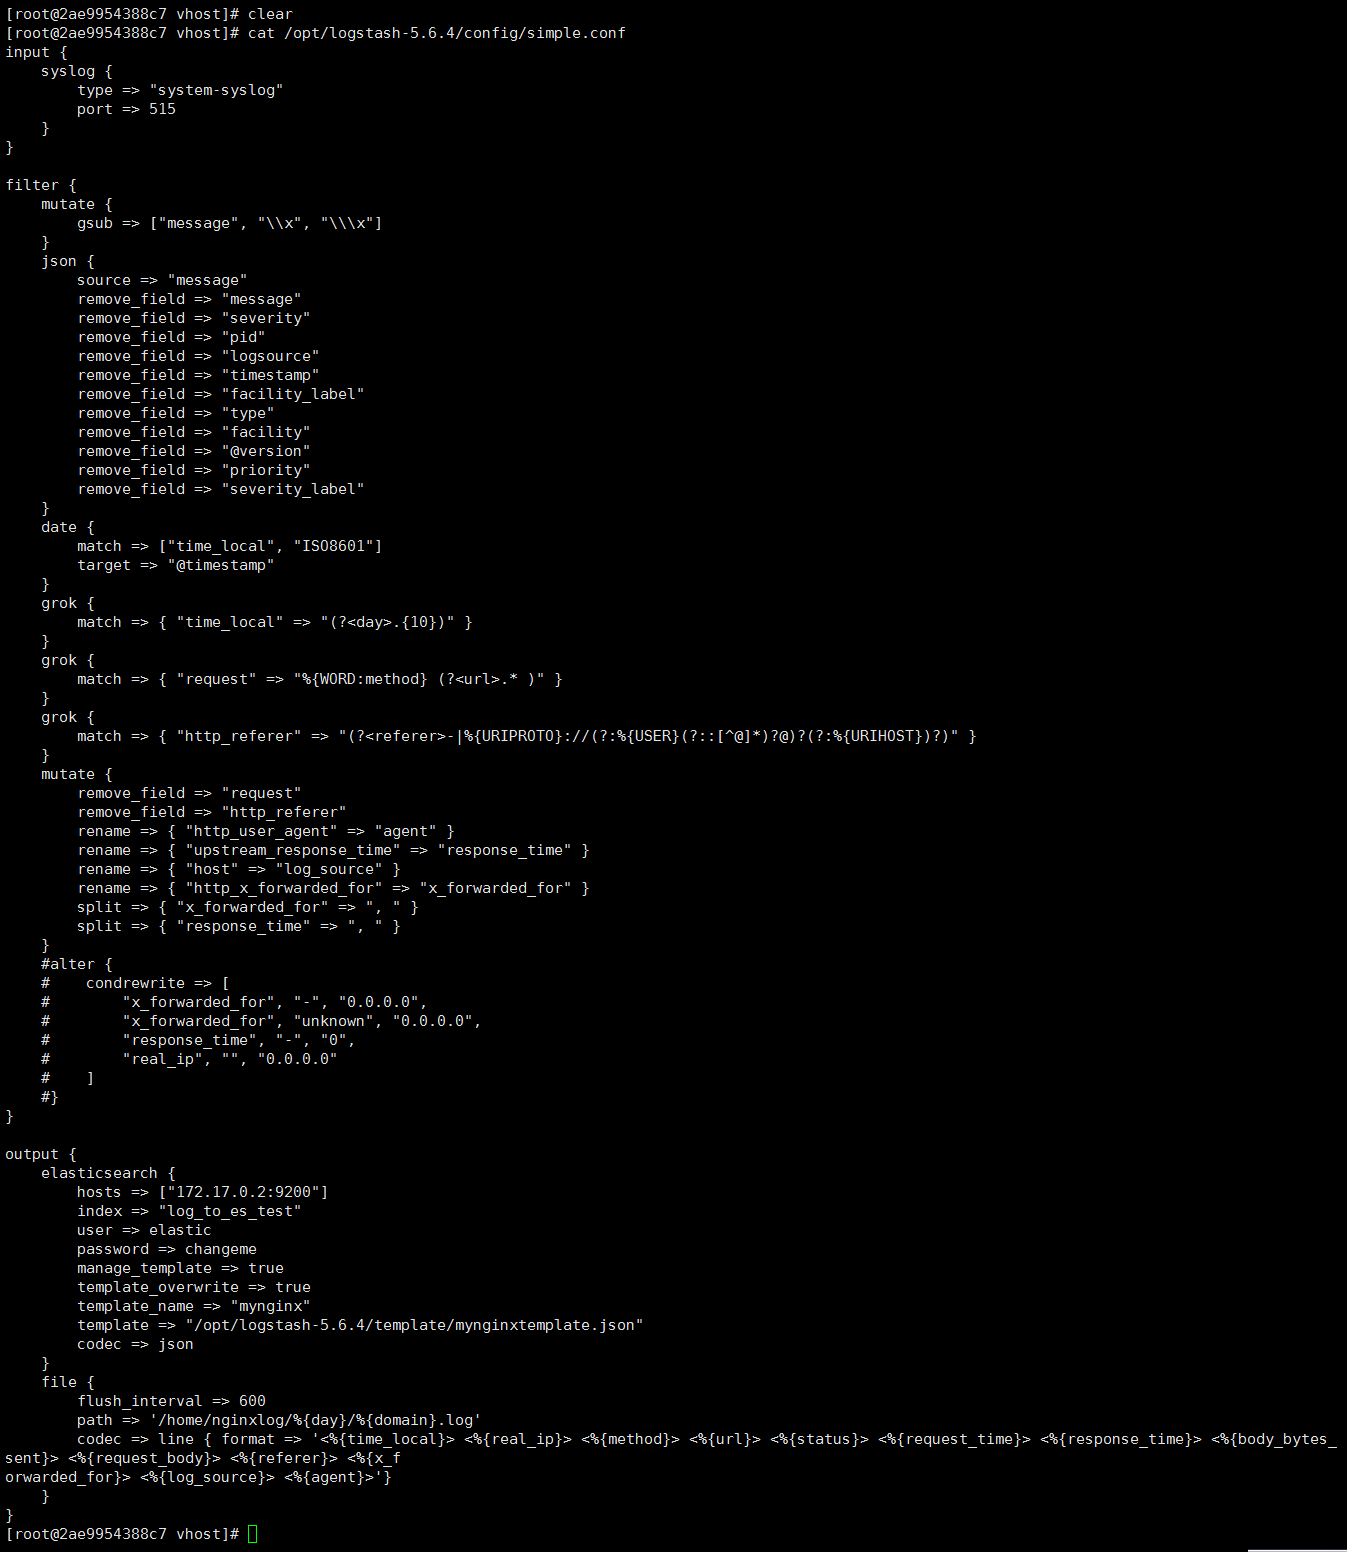
解析(样例):
|
1 2 3 4 5 6 7 8 9 10 11 12 13 14 15 16 17 18 19 20 21 22 23 24 25 26 27 28 29 30 31 32 33 34 35 36 37 38 39 40 41 42 43 44 45 46 47 48 49 50 51 52 53 54 55 56 57 58 59 60 61 62 63 64 65 66 67 68 69 70 71 72 73 74 75 76 77 78 79 80 81 82 83 84 85 86 |
input { syslog {#接收模式为syslog 当然你也可以用文件的形式 type => "system-syslog" port => 515 # 这里的端口要和你nginx配置文件里access_log配置的一致,这里为接收发送日志端口 } } filter { #在json化之前,使用mutte对\\x字符串进行替换,防止以下错误:ParserError: Unrecognized character escape 'x' (code 120) mutate { gsub => ["message", "\\x", "\\\x"] } json { source => "message" #删除无用字段,节约空间 remove_field => "message" remove_field => "severity" remove_field => "pid" remove_field => "logsource" remove_field => "timestamp" remove_field => "facility_label" remove_field => "type" remove_field => "facility" remove_field => "@version" remove_field => "priority" remove_field => "severity_label" } date { #用nginx请求时间替换logstash生成的时间 match => ["time_local", "ISO8601"] target => "@timestamp" } grok { #从时间中获取day match => { "time_local" => "(?<day>.{10})" } } grok { #将request解析成2个字段:method\url match => { "request" => "%{WORD:method} (?<url>.* )" } } grok { #截取http_referer问号前的部分,问号后的信息无价值,浪费空间 match => { "http_referer" => "(?<referer>-|%{URIPROTO}://(?:%{USER}(?::[^@]*)?@)?(?:%{URIHOST})?)" } } mutate { #解析出新的字段后,原字段丢弃 remove_field => "request" remove_field => "http_referer" rename => { "http_user_agent" => "agent" } rename => { "upstream_response_time" => "response_time" } rename => { "host" => "log_source" } rename => { "http_x_forwarded_for" => "x_forwarded_for" } #以下2个字段以逗号分隔后,以数组形式入库 split => { "x_forwarded_for" => ", " } split => { "response_time" => ", " } } alter { #不满足elasticsearch索引模型的,入库会失败,因此做以下数据转换 condrewrite => [ "x_forwarded_for", "-", "0.0.0.0", "x_forwarded_for", "unknown", "0.0.0.0", "response_time", "-", "0", "real_ip", "", "0.0.0.0" ] } } output { #入库,以template指定的模型作为索引模型 elasticsearch { hosts => ["elasticsearch_ip:9200"] index => "nginx-%{day}" manage_template => true template_overwrite => true template_name => "mynginx" template => "/root/logstash/mynginxtemplate.json" codec => json } #本地文件放一份,作为ELK的补充 file { flush_interval => 600 path => '/nginxlog/%{day}/%{domain}.log' codec => line { format => '<%{time_local}> <%{real_ip}> <%{method}> <%{url}> <%{status}> <%{request_time}> <%{response_time}> <%{body_bytes_sent}> <%{request_body}> <%{referer}> <%{x_f orwarded_for}> <%{log_source}> <%{agent}>'} } } |
日志模板文件 mynginxtemplate.json
|
1 2 3 4 5 6 7 8 9 10 11 12 13 14 15 16 17 18 19 20 21 22 23 24 25 26 27 28 29 30 31 32 33 34 35 36 37 38 39 40 41 42 43 44 45 46 47 48 49 50 51 52 53 54 55 56 57 58 59 60 61 62 63 64 65 66 67 68 69 70 71 72 73 74 75 76 77 78 79 80 81 82 83 84 85 86 87 88 89 90 91 92 |
{ "template": "nginx-*", "settings": { "index.number_of_shards": 8, "number_of_replicas": 0, "analysis": { "analyzer": { #自定义stop关键字,不收集http等字段的索引 "stop_url": { "type": "stop", "stopwords": ["http","https","www","com","cn","net"] } } } }, "mappings" : { "doc" : { "properties" : { # index:true 分词、生产搜索引擎 # analyzer:指定索引分析器 "referer": { "type": "text", "norms": false, "index": true, "analyzer": "stop_url" }, "agent": { "type": "text", "norms": false, "index": true }, # IP字段类型 "real_ip": { "type": "ip" }, "x_forwarded_for": { "type": "ip" }, # keyword,作为完整字段索引,不可分词索引 "status": { "type": "keyword" }, "method": { "type": "keyword" }, "url": { "type": "text", "norms": false, "index": true, "analyzer": "stop_url" }, "status": { "type": "keyword" }, "response_time": { "type": "half_float" }, "request_time": { "type": "half_float" }, "domain": { "type": "keyword" }, "project": { "type": "keyword" }, "request_body": { "type": "text", "norms": false, "index": true }, "body_bytes_sent": { "type": "long" }, "log_source": { "type": "ip" }, "@timestamp" : { "type" : "date", "format" : "dateOptionalTime", "doc_values" : true }, "time_local": { "enabled": false }, "day": { "enabled": false } } } } } |
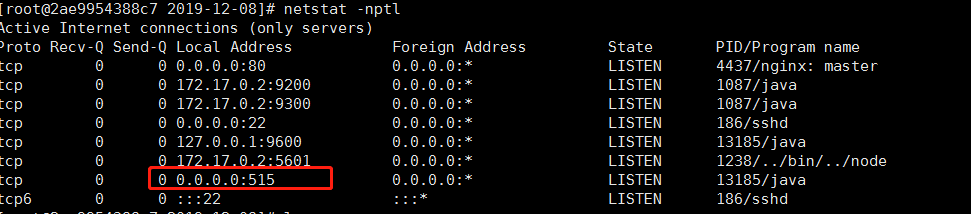
配置完后重新启动logstash
使用命令查看515端口是否启用
netstat -nptl
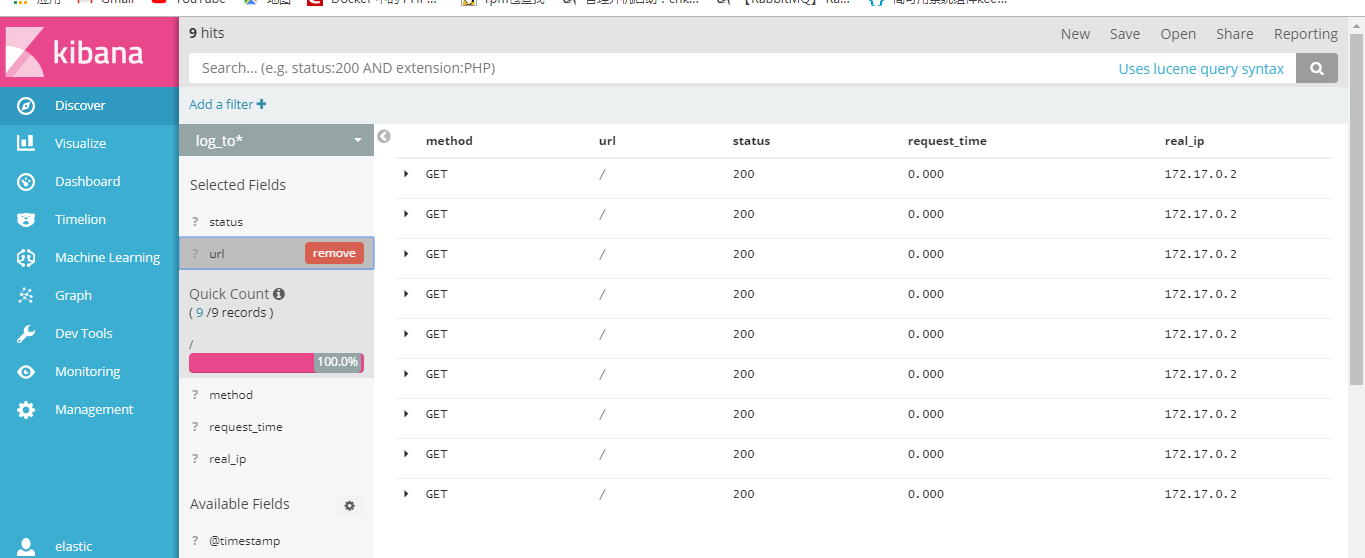
使用网页访问你刚才配置日志发送的域名,然后查看kibana后台
- 本文固定链接: https://www.yoyoask.com/?p=643
- 转载请注明: shooter 于 SHOOTER 发表
这个作者貌似有点懒,什么都没有留下。