通过docker-compose部署prometheus、node-exporter、alertmanager、cadvisor 和grafana。prometheus最新版本:2.19.2
监控服务器 需要安装5个服务:
- Prometheus Server(普罗米修斯监控主服务器 )
- Node Exporter (收集Host硬件和操作系统信息)
- cAdvisor (负责收集Host上运行的容器信息)
- Grafana (展示普罗米修斯监控界面)
- alertmanager (告警)
被监控的只需安装2个:
- Node Exporter (收集Host硬件和操作系统信息)
- cAdvisor (负责收集Host上运行的容器信息)
1.创建应用存储目录
|
1 2 3 4 5 |
mkdir -p /home/prom/{prometheus,prometheus/data,alertmanager,grafana} chmod 777 /home/prom/{prometheus/data,grafana} cd /home/prom |
2.编写prometheus规则文件
|
1 |
vim /home/prom/prometheus/alert-rules.yml |
|
1 2 3 4 5 6 7 8 9 10 11 12 13 14 15 16 17 18 19 20 21 22 23 24 25 26 27 28 29 30 31 32 33 34 35 36 37 38 39 40 41 42 43 44 45 46 47 48 49 50 51 52 53 54 55 56 57 58 59 60 61 62 63 64 65 66 67 68 69 70 71 72 73 74 75 76 77 78 79 80 81 82 83 84 85 86 87 88 89 90 91 92 93 94 95 96 97 98 99 100 101 102 103 104 105 106 107 108 109 110 111 112 113 114 115 116 117 118 119 120 121 122 123 124 125 126 127 128 129 130 131 132 133 134 135 136 137 138 139 140 141 142 143 144 145 146 147 148 149 150 151 152 153 154 155 156 157 158 159 160 161 162 163 164 165 166 167 168 169 170 171 172 173 174 175 176 177 178 179 180 181 182 183 184 185 186 187 188 189 190 191 192 193 194 195 196 197 198 199 200 201 202 203 204 205 206 207 208 209 210 211 212 213 214 215 216 217 218 219 220 221 222 223 |
groups: - name: node-alert rules: - alert: NodeDown expr: up{job="node"} == 0 for: 5m labels: severity: critical instance: "{{ $labels.instance }}" annotations: summary: "instance: {{ $labels.instance }} down" description: "Instance: {{ $labels.instance }} 已经宕机 5分钟" value: "{{ $value }}" - alert: NodeCpuHigh expr: (1 - avg by (instance) (irate(node_cpu_seconds_total{job="node",mode="idle"}[5m]))) * 100 > 80 for: 5m labels: severity: warning instance: "{{ $labels.instance }}" annotations: summary: "instance: {{ $labels.instance }} cpu使用率过高" description: "CPU 使用率超过 80%" value: "{{ $value }}" - alert: NodeCpuIowaitHigh expr: avg by (instance) (irate(node_cpu_seconds_total{job="node",mode="iowait"}[5m])) * 100 > 50 for: 5m labels: severity: warning instance: "{{ $labels.instance }}" annotations: summary: "instance: {{ $labels.instance }} cpu iowait 使用率过高" description: "CPU iowait 使用率超过 50%" value: "{{ $value }}" - alert: NodeLoad5High expr: node_load5 > (count by (instance) (node_cpu_seconds_total{job="node",mode='system'})) * 1.2 for: 5m labels: severity: warning instance: "{{ $labels.instance }}" annotations: summary: "instance: {{ $labels.instance }} load(5m) 过高" description: "Load(5m) 过高,超出cpu核数 1.2倍" value: "{{ $value }}" - alert: NodeMemoryHigh expr: (1 - node_memory_MemAvailable_bytes{job="node"} / node_memory_MemTotal_bytes{job="node"}) * 100 > 90 for: 5m labels: severity: warning instance: "{{ $labels.instance }}" annotations: summary: "instance: {{ $labels.instance }} memory 使用率过高" description: "Memory 使用率超过 90%" value: "{{ $value }}" - alert: NodeDiskRootHigh expr: (1 - node_filesystem_avail_bytes{job="node",fstype=~"ext.*|xfs",mountpoint ="/"} / node_filesystem_size_bytes{job="node",fstype=~"ext.*|xfs",mountpoint ="/"}) * 100 > 90 for: 10m labels: severity: warning instance: "{{ $labels.instance }}" annotations: summary: "instance: {{ $labels.instance }} disk(/ 分区) 使用率过高" description: "Disk(/ 分区) 使用率超过 90%" value: "{{ $value }}" - alert: NodeDiskBootHigh expr: (1 - node_filesystem_avail_bytes{job="node",fstype=~"ext.*|xfs",mountpoint ="/boot"} / node_filesystem_size_bytes{job="node",fstype=~"ext.*|xfs",mountpoint ="/boot"}) * 100 > 80 for: 10m labels: severity: warning instance: "{{ $labels.instance }}" annotations: summary: "instance: {{ $labels.instance }} disk(/boot 分区) 使用率过高" description: "Disk(/boot 分区) 使用率超过 80%" value: "{{ $value }}" - alert: NodeDiskReadHigh expr: irate(node_disk_read_bytes_total{job="node"}[5m]) > 20 * (1024 ^ 2) for: 5m labels: severity: warning instance: "{{ $labels.instance }}" annotations: summary: "instance: {{ $labels.instance }} disk 读取字节数 速率过高" description: "Disk 读取字节数 速率超过 20 MB/s" value: "{{ $value }}" - alert: NodeDiskWriteHigh expr: irate(node_disk_written_bytes_total{job="node"}[5m]) > 20 * (1024 ^ 2) for: 5m labels: severity: warning instance: "{{ $labels.instance }}" annotations: summary: "instance: {{ $labels.instance }} disk 写入字节数 速率过高" description: "Disk 写入字节数 速率超过 20 MB/s" value: "{{ $value }}" - alert: NodeDiskReadRateCountHigh expr: irate(node_disk_reads_completed_total{job="node"}[5m]) > 3000 for: 5m labels: severity: warning instance: "{{ $labels.instance }}" annotations: summary: "instance: {{ $labels.instance }} disk iops 每秒读取速率过高" description: "Disk iops 每秒读取速率超过 3000 iops" value: "{{ $value }}" - alert: NodeDiskWriteRateCountHigh expr: irate(node_disk_writes_completed_total{job="node"}[5m]) > 3000 for: 5m labels: severity: warning instance: "{{ $labels.instance }}" annotations: summary: "instance: {{ $labels.instance }} disk iops 每秒写入速率过高" description: "Disk iops 每秒写入速率超过 3000 iops" value: "{{ $value }}" - alert: NodeInodeRootUsedPercentHigh expr: (1 - node_filesystem_files_free{job="node",fstype=~"ext4|xfs",mountpoint="/"} / node_filesystem_files{job="node",fstype=~"ext4|xfs",mountpoint="/"}) * 100 > 80 for: 10m labels: severity: warning instance: "{{ $labels.instance }}" annotations: summary: "instance: {{ $labels.instance }} disk(/ 分区) inode 使用率过高" description: "Disk (/ 分区) inode 使用率超过 80%" value: "{{ $value }}" - alert: NodeInodeBootUsedPercentHigh expr: (1 - node_filesystem_files_free{job="node",fstype=~"ext4|xfs",mountpoint="/boot"} / node_filesystem_files{job="node",fstype=~"ext4|xfs",mountpoint="/boot"}) * 100 > 80 for: 10m labels: severity: warning instance: "{{ $labels.instance }}" annotations: summary: "instance: {{ $labels.instance }} disk(/boot 分区) inode 使用率过高" description: "Disk (/boot 分区) inode 使用率超过 80%" value: "{{ $value }}" - alert: NodeFilefdAllocatedPercentHigh expr: node_filefd_allocated{job="node"} / node_filefd_maximum{job="node"} * 100 > 80 for: 10m labels: severity: warning instance: "{{ $labels.instance }}" annotations: summary: "instance: {{ $labels.instance }} filefd 打开百分比过高" description: "Filefd 打开百分比 超过 80%" value: "{{ $value }}" - alert: NodeNetworkNetinBitRateHigh expr: avg by (instance) (irate(node_network_receive_bytes_total{device=~"eth0|eth1|ens33|ens37"}[1m]) * 8) > 20 * (1024 ^ 2) * 8 for: 3m labels: severity: warning instance: "{{ $labels.instance }}" annotations: summary: "instance: {{ $labels.instance }} network 接收比特数 速率过高" description: "Network 接收比特数 速率超过 20MB/s" value: "{{ $value }}" - alert: NodeNetworkNetoutBitRateHigh expr: avg by (instance) (irate(node_network_transmit_bytes_total{device=~"eth0|eth1|ens33|ens37"}[1m]) * 8) > 20 * (1024 ^ 2) * 8 for: 3m labels: severity: warning instance: "{{ $labels.instance }}" annotations: summary: "instance: {{ $labels.instance }} network 发送比特数 速率过高" description: "Network 发送比特数 速率超过 20MB/s" value: "{{ $value }}" - alert: NodeNetworkNetinPacketErrorRateHigh expr: avg by (instance) (irate(node_network_receive_errs_total{device=~"eth0|eth1|ens33|ens37"}[1m])) > 15 for: 3m labels: severity: warning instance: "{{ $labels.instance }}" annotations: summary: "instance: {{ $labels.instance }} 接收错误包 速率过高" description: "Network 接收错误包 速率超过 15个/秒" value: "{{ $value }}" - alert: NodeNetworkNetoutPacketErrorRateHigh expr: avg by (instance) (irate(node_network_transmit_packets_total{device=~"eth0|eth1|ens33|ens37"}[1m])) > 15 for: 3m labels: severity: warning instance: "{{ $labels.instance }}" annotations: summary: "instance: {{ $labels.instance }} 发送错误包 速率过高" description: "Network 发送错误包 速率超过 15个/秒" value: "{{ $value }}" - alert: NodeProcessBlockedHigh expr: node_procs_blocked{job="node"} > 10 for: 10m labels: severity: warning instance: "{{ $labels.instance }}" annotations: summary: "instance: {{ $labels.instance }} 当前被阻塞的任务的数量过多" description: "Process 当前被阻塞的任务的数量超过 10个" value: "{{ $value }}" - alert: NodeTimeOffsetHigh expr: abs(node_timex_offset_seconds{job="node"}) > 3 * 60 for: 2m labels: severity: info instance: "{{ $labels.instance }}" annotations: summary: "instance: {{ $labels.instance }} 时间偏差过大" description: "Time 节点的时间偏差超过 3m" value: "{{ $value }}" |
3. 编写prometheus配置文件
|
1 |
vim /home/prom/prometheus/prometheus.yml |
|
1 2 3 4 5 6 7 8 9 10 11 12 13 14 15 16 17 18 19 20 21 22 23 24 25 26 27 28 29 30 |
global: scrape_interval: 15s evaluation_interval: 15s alerting: alertmanagers: - static_configs: - targets: - alertmanager:9093 rule_files: - "*rules.yml" scrape_configs: - job_name: 'prometheus' static_configs: - targets: ['prometheus:9090'] - job_name: 'node' static_configs: - targets: ['node-exporter:9100'] - job_name: 'alertmanager' static_configs: - targets: ['alertmanager:9093'] - job_name: 'cAdvisor' static_configs: - targets: ['192.168.0.209:8091'] |
4.编写alertManager配置文件
|
1 |
vim /home/prom/alertmanager/config.yml |
|
1 2 3 4 5 |
targets: webhook: url: https://oapi.dingtalk.com/robot/send?access_token=xxxxxxxxxxxx #修改为钉钉机器人的webhook mention: all: true |
|
1 |
vim /home/prom/alertmanager/alertmanager.yml |
|
1 2 3 4 5 6 7 8 9 10 11 12 13 14 15 16 17 18 19 20 21 22 23 24 25 26 27 28 29 30 |
global: resolve_timeout: 5m smtp_smarthost: 'smtp.163.com:465' #邮箱smtp服务器代理,启用SSL发信, 端口一般是465 smtp_from: 'alert@163.com' #发送邮箱名称 smtp_auth_username: 'alert@163.com' #邮箱名称 smtp_auth_password: 'password' #邮箱密码或授权码 smtp_require_tls: false route: receiver: 'default' group_wait: 10s group_interval: 1m repeat_interval: 1h group_by: ['alertname'] inhibit_rules: - source_match: severity: 'critical' target_match: severity: 'warning' equal: ['alertname', 'instance'] receivers: - name: 'default' email_configs: - to: 'receiver@163.com' send_resolved: true webhook_configs: - url: 'http://dingtalk:8060/dingtalk/webhook/send' send_resolved: true |
5. 使用docker-compose启动
|
1 2 3 4 5 6 7 8 9 10 11 12 13 14 15 16 17 18 19 20 21 22 23 24 25 26 27 28 29 30 31 32 33 34 35 36 37 38 39 40 41 42 43 44 45 46 47 48 49 50 51 52 53 54 55 56 57 58 59 60 61 62 63 64 65 66 67 68 69 70 71 72 73 74 75 76 77 78 79 80 81 82 83 84 85 86 87 88 89 90 91 92 93 94 95 96 97 98 99 100 101 102 103 104 105 |
version: '3.7' services: node-exporter: image: prom/node-exporter:latest ports: - "9100:9100" networks: - prom dingtalk: image: timonwong/prometheus-webhook-dingtalk:latest volumes: - type: bind source: /home/prom/alertmanager/config.yml target: /etc/prometheus-webhook-dingtalk/config.yml read_only: true ports: - "8060:8060" networks: - prom alertmanager: depends_on: - dingtalk image: prom/alertmanager:latest volumes: - type: bind source: /home/prom/alertmanager/alertmanager.yml target: /etc/alertmanager/alertmanager.yml read_only: true ports: - "9093:9093" - "9094:9094" networks: - prom prometheus: depends_on: - alertmanager image: prom/prometheus:latest volumes: - type: bind source: /home/prom/prometheus/prometheus.yml target: /etc/prometheus/prometheus.yml read_only: true - type: bind source: /home/prom/prometheus/alert-rules.yml target: /etc/prometheus/alert-rules.yml read_only: true - type: volume source: prometheus target: /prometheus ports: - "9090:9090" networks: - prom cadvisor: container_name: cadvisor depends_on: - alertmanager image: google/cadvisor:latest ports: - "8091:8080" volumes: - /:/rootfs:ro - /var/run:/var/run:rw - /sys:/sys:ro - /var/lib/docker/:/var/lib/docker:ro - /dev/disk/:/dev/disk:ro networks: - prom grafana: depends_on: - prometheus image: grafana/grafana:latest volumes: - type: volume source: grafana target: /var/lib/grafana ports: - "3000:3000" networks: - prom volumes: prometheus: driver: local driver_opts: type: none o: bind device: /home/prom/prometheus/data grafana: driver: local driver_opts: type: none o: bind device: /home/prom/grafana networks: prom: driver: bridge |
6. 启动
|
1 |
docker-compose up -d |

7.查看Cadvisor
|
1 |
http://192.168.0.209:8091/docker/ |

|
1 |
访问http://192.168.0.209:8091/metrics 可以查看其暴露给 Prometheus 的所有数据,也就可以以此数据修改grafana view获取不到数据的模块 |
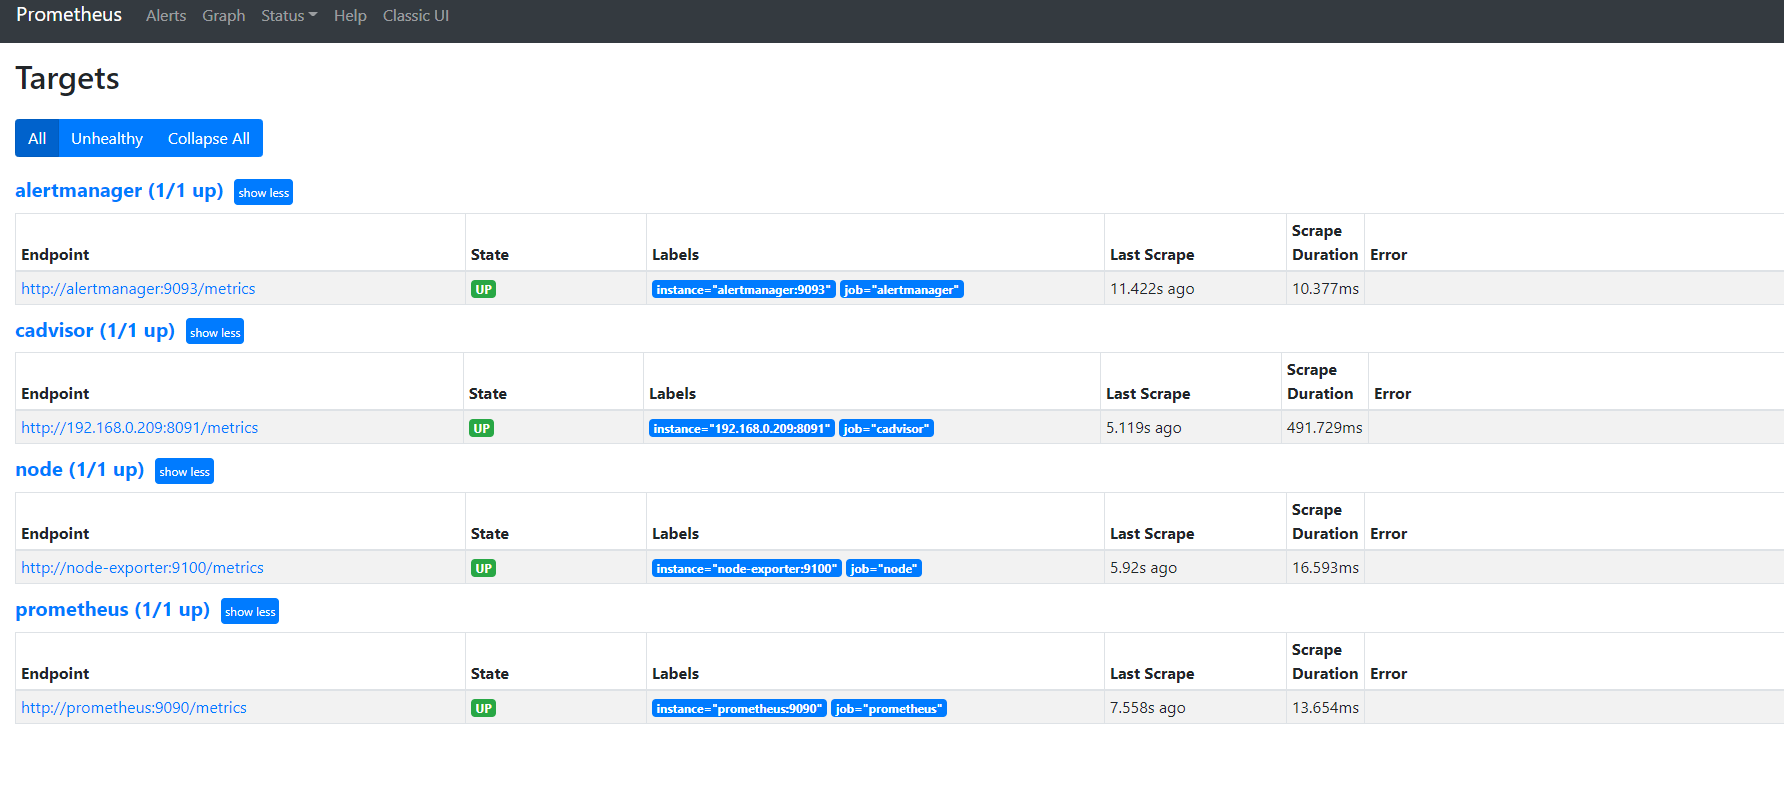
7.访问prometheus
|
1 2 |
http://IP:9090 查看相关服务是否都启动正常 |
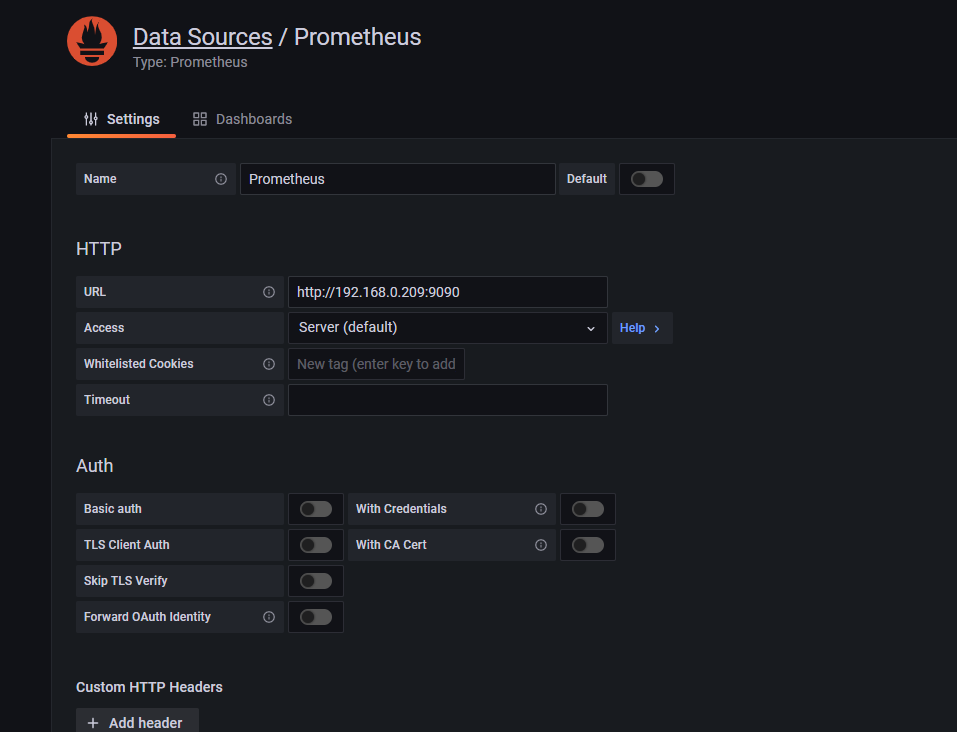
8.访问grafana
|
1 2 |
http://ip:3000 #设置prometheus 的data Sources |
9.选取数据源做图形显示
|
1 |
去官网下载地址:https://grafana.com/grafana/dashboards 筛选模板 |

我选择第一个下载人数最多的

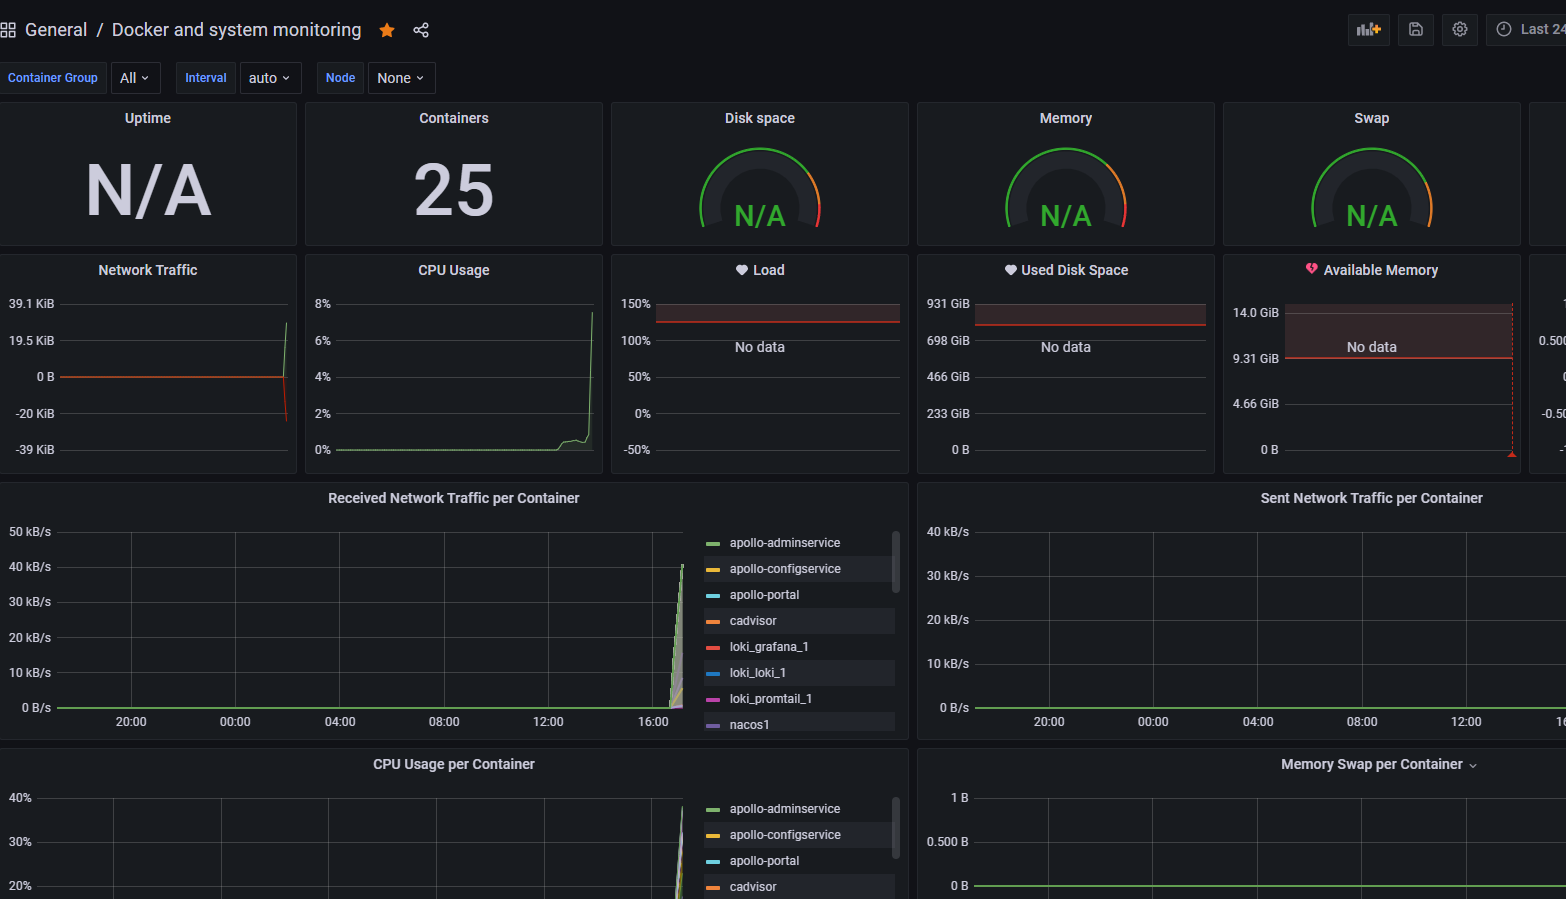
10. 导入监控宿主机图表


|
1 2 |
主机监控 推荐模板:9276 推荐模板:193 推荐模板:12633 mysql 推荐模板:7362 |
- 本文固定链接: https://www.yoyoask.com/?p=6312
- 转载请注明: shooter 于 SHOOTER 发表
这个作者貌似有点懒,什么都没有留下。